GoLIBERTA
Market Intelligence
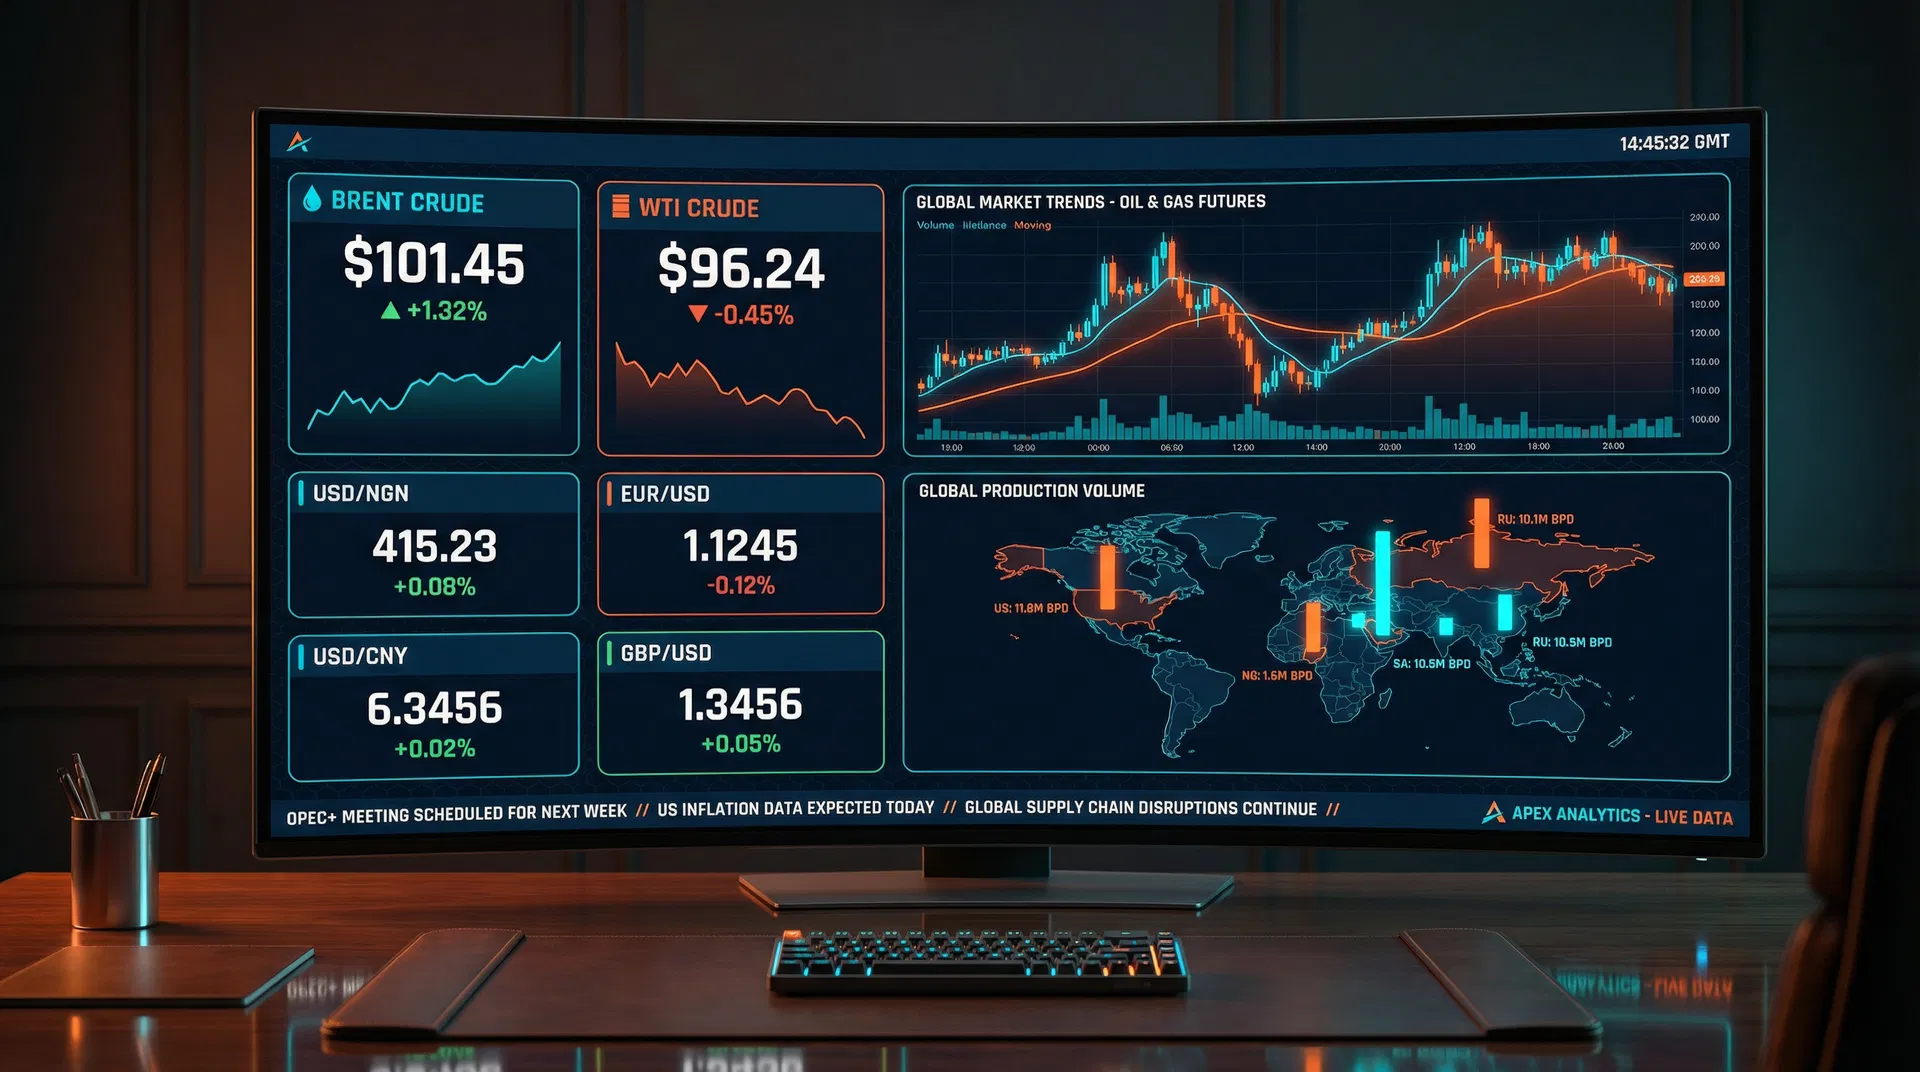
Real-time crude oil prices, natural gas benchmarks, global production volumes, and currency exchange rates — all in one executive-grade dashboard built for energy professionals.
Everything You Need to Track Energy Markets
Four integrated market intelligence modules, each with live data feeds, global event context, and 12-month trend analysis.
Crude Oil Prices
Track Brent, WTI, and Bonny Light crude benchmarks in real time with day range indicators and change metrics.
- Brent Crude (ICE Futures)
- WTI Crude (NYMEX)
- Bonny Light (Nigeria OTC)
- Day high/low range bar
- 12-month trend chart
Natural Gas Prices
Monitor Henry Hub spot and LNG via TTF — the two dominant global gas benchmarks used in trading and contract pricing.
- Henry Hub (USD/MMBtu)
- LNG via TTF (EUR/MWh)
- Change vs previous close
- Global event context
- 12-month trend chart
Production Volumes
Compare crude oil production volumes across the four largest producing nations with relative share bars.
- Nigeria (NUPRC data)
- Saudi Arabia (OPEC)
- USA (EIA figures)
- Russia (official data)
- Quarterly updated
Exchange Rates
Live forex rates critical for oil revenue calculations, contract settlements, and cross-border energy transactions.
- USD/NGN (Naira rate)
- EUR/USD (Euro cross)
- USD/CNY (Yuan rate)
- Day range & change
- 12-month trend chart
Bloomberg-Grade Data. Executive Clarity.
The GoLIBERTA dashboard delivers institutional-quality market data in a clean, fast interface designed for senior energy professionals. Every price card includes global event context — the three macro forces currently moving each market — so you always understand the "why" behind the numbers.
- Flash animations on every live price update
- Top 3 global events per instrument with bullish/bearish tags
- Click any card to open a 12-month weekly trend chart
- Auto-refreshes every 60 seconds with countdown ring
- Fully responsive — works on desktop, tablet, and mobile
Built by Energy Professionals, for Energy Professionals.
GoLIBERTA Market Intelligence was conceived by a senior oil and gas consultant with over three decades of operational leadership across Africa, the Americas, Asia, and Europe — including the historic Renaissance SPDC asset acquisition in Nigeria.
The platform aggregates the data points that matter most to energy executives: crude benchmarks (including Nigeria's Bonny Light), gas price indices, production volumes from the world's top producers, and the foreign exchange rates that directly impact revenue calculations and contract settlements.
Every instrument is paired with curated global event context — the macro forces currently driving price movements — so decision-makers can act with both speed and understanding.
The Markets That Move the World's Energy
From the North Sea to the Gulf of Mexico, from the Niger Delta to the Strait of Hormuz — GoLIBERTA tracks the benchmarks that set the global energy price.
- Bonny Light Crude (Nigeria)
- Brent (North Sea proxy)
- USD/NGN Exchange Rate
- OPEC+ Production Data
- WTI Crude (NYMEX)
- Henry Hub Natural Gas
- USD/CNY (Trade flows)
- US EIA Production Data
- LNG via TTF (EUR/MWh)
- EUR/USD Exchange Rate
- Russian Production Data
- Saudi Aramco Output
Ready to Track the Global Energy Market?
Open the GoLIBERTA dashboard now — live prices, global events, and 12-month trends, all in one place.
Open Live Dashboard